Top of this page
Skip navigation, go straight to the content
ISLES 2014
Research
Wireless communication
Within the ISLES project, SAN investigates the communication infrastructure and the related deployment procedures. Since the communication infrastructure is used to exchange information about detected traffic and to perform remote management, deployments of light poles are analysed with respect to connectivity properties, available network bandwidth and communication delays. To ensure that deployments are based on real-life situations, available GIS datasets of light pole deployments are used as examples. By combining these datasets with information about the environment (like buildings and landuse), it is possible to create more accurate communication models.
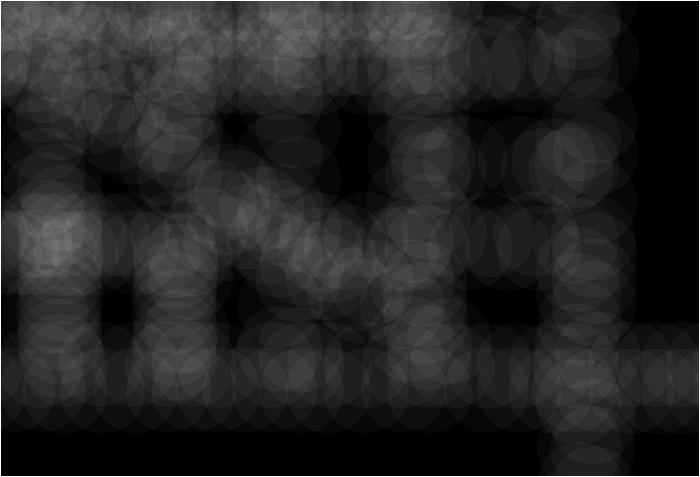 The image on the right shows the radio coverage of an area in Washington DC,
when each light pole has a communication range of 50 meters, not taking obstacles into account.
It is clear that the coverage differs considerably for different areas.
The image on the right shows the radio coverage of an area in Washington DC,
when each light pole has a communication range of 50 meters, not taking obstacles into account.
It is clear that the coverage differs considerably for different areas.
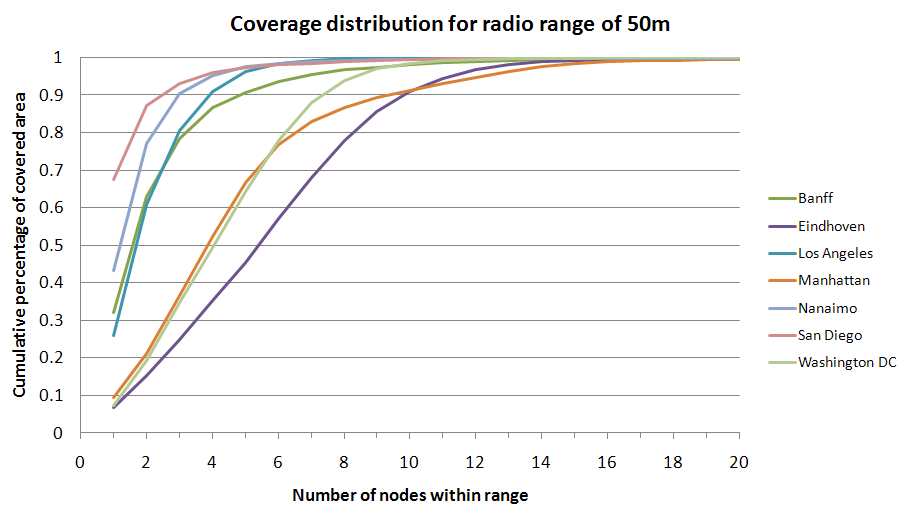
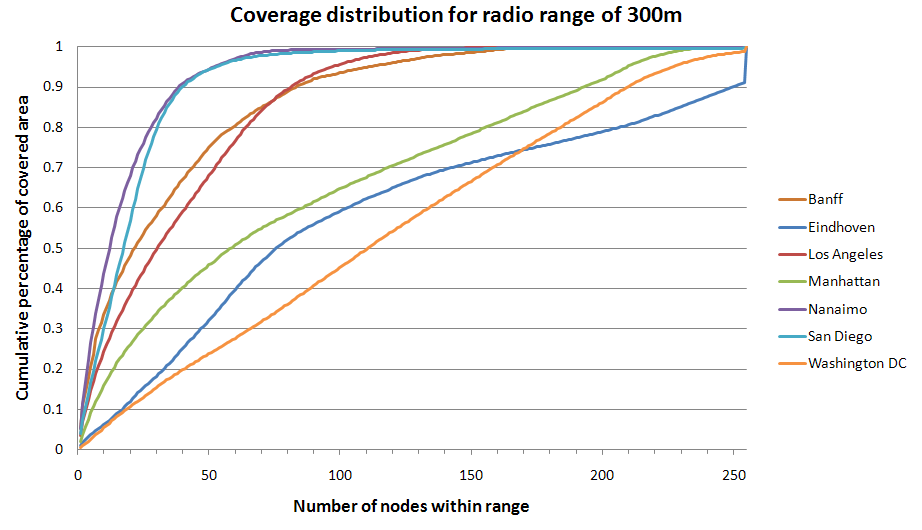
Based on the radio coverage, the number of light poles within communication range can be determined for any position in the area. The cumulative distribution of the number of light poles within range is shown in the graphs below, for communication ranges of 50 and 300 meters. The distribution curve is provided for 7 different data sets (Banff, Eindhoven, Los Angeles, Manhattan, Nanaimo, San Diego and Washington DC), and it is clear that the densitity of light poles differs greately between cities, but also within cities. For a communication range of 300 meters, it is not uncommon to have more than 200 light poles within range. With respect to communication, it introduces severe restrictions on the available bandwidth and on periodic communication.
 |
 |
Network deployment
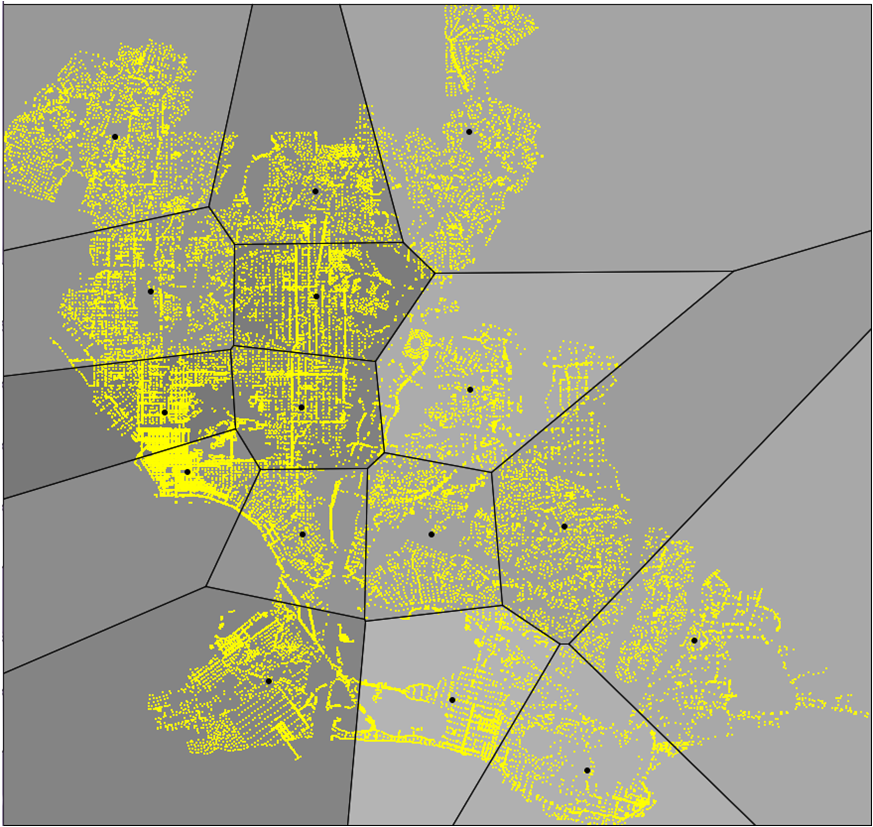
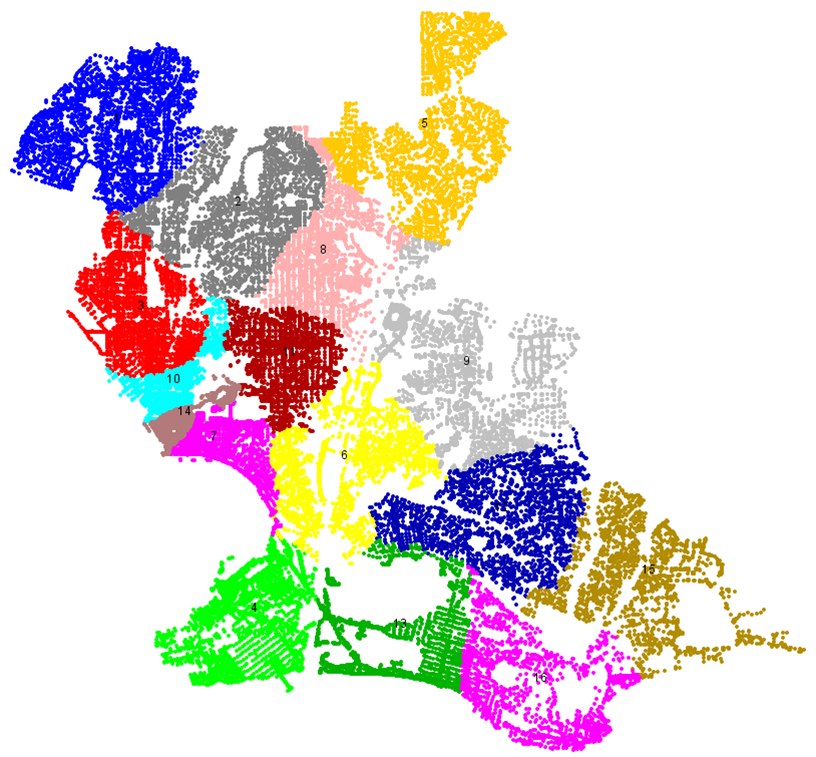
During the installation and operational phase, the light poles are managed from remote through so-called segment controllers. The deployment of segment controllers throughout a city introduces a challenging optimization problem. The figures below show the selection of initial positions and a final segmentation based on specific optimization criteria. The positions of light poles are from the San Diego dataset.
 |  |
Dynamic illumination
When traffic is detected, the relevant information needs to be exchanged with
neighbors, such that the illumination control algorithms can make the proper
adjustments. Geocast and gossipping routing algorithms can be applied, although
the control algorithm should avoid incorrect illumination (which might result
in reports of broken systems by inhabitants). In addition, the control
algorithms should take safety regulations into account, such as road crossings and special weather conditions.
Recommendations from CIE, NSVV and IGOV provide a starting point with respect to safety.
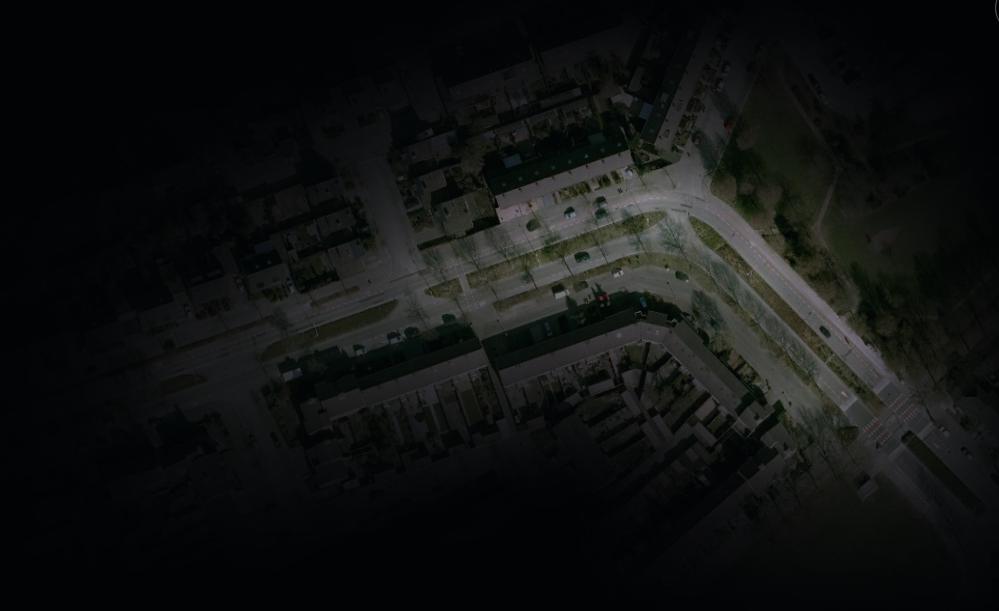
The figure below shows a virtual illumination pattern around a virtual car
and the related simulation shows how the illumination along a road could adapt based on a detected object.
By incorporating more details about the environment, like buildings,
road crossings and specific light distribution patterns, it would be possible
to determine the quality of the illumination.
Software tools like DIALux, ReluxSuite, Calculux and RoadWizard can provide detailed evaluations.
 |
Cost effective?
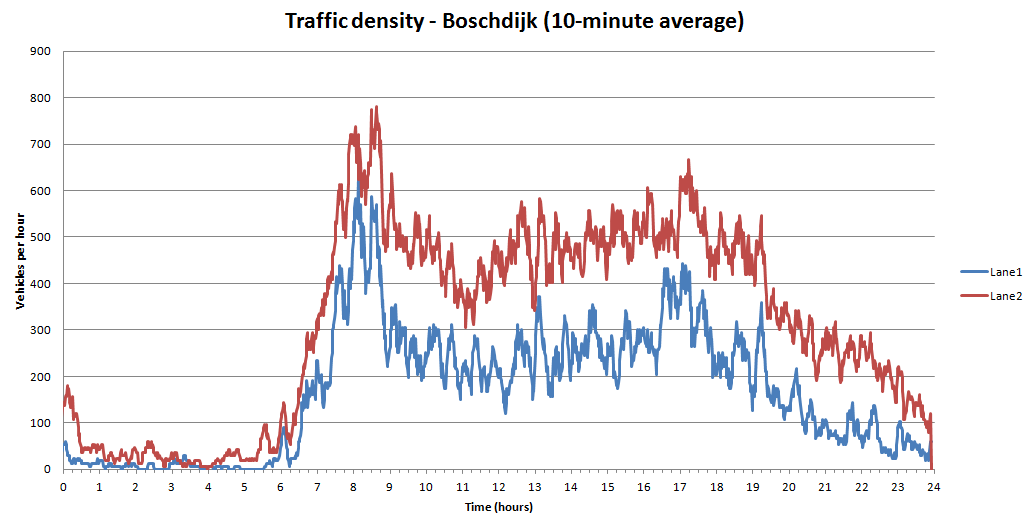
Although a dynamic street lighting system should reduce light pollution and energy consumption, the additional hardware for traffic detection and communication will consume energy as well. For a cost-effective deployment, different hardware configurations can be selected based on traffic densities and safety regulations. Depending on the situation, a static dimming schedule could be preferred compared to a dynamic system based on traffic detection. The graph below shows the traffic intensity on two lanes of Boschdijk, on Wednesday, April 20, 2011 (as collected by NDW). Boschdijk is one of the entry roads of Eindhoven and therefore more intensively used. Although the period between 00:30 and 05:30 is rather idle with respect to traffic, the few vehicles could be sufficient to render dynamic illumination inefficient. That is, the expected energy savings will not cover the costs of the additional hardware within the expected lifetime.
 |
March 2013
UMTS performance measurements at Achtse Barrier
Summer&Autumn, 2012
Theoretical work on segmentation algorithms
March 2012
November 2011
UMTS performance measurements at Achtse Barrier
March 2011
Kickoff meeting