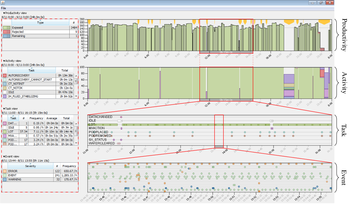
Visualization of diagnostics data sets at ASML
Facts
| Type | master project |
|---|---|
| Place | external |
| Supervisors | Jack van Wijk |
| Student | Han van Venrooij |
| Thesis | download |
| start/end date | 08/2013-05-2014 |
Description
ASML is a leading supplier of lithography equipment for the semiconductor industry. ASML's wafer scanners are complex systems involving nanometer-accuracy optics and mechatronics, as well as significant amounts of software and real-time control. Software in each machine records the machine's operations (including numerous warning and errors) in a so-called Event Log. The scanners are networked and the event log data is automatically sent to ASML's headquarters (for hundreds of machines throughout the world). A log typically collects hundreds of events per hour - even if the machine is operating perfectly. Diagnostics of downtime in the field largely relies on a field service engineer who relies on manual inspection of the event log: the field service engineer is expected to diagnose most machine failures using the event log and using an online knowledge base.
Assignment
The event log is currently viewed in textual form. Can the event log of a single system be represented graphically (e.g. for a Field Service Engineer with a laptop) in such a way that a user can readily get:
- overview of what the machine has been doing in the recent past (at least 24 hours, see attached experimental example). This would display at least top-level operating modes (production, test, calibration, service, idle…).
- details of individual events, series of events and deviations from normal behavior
- linkage to a timescale, and
- linkage to the current detailed textual descriptions of individual events
Preferably more information can be added to show understood (“linked events”) and suspected (“patterns”) structure representing cause-and-effect relationships, information about which part of the system reported an event, the state of major subsystems (e.g. wafer handling, wafer exposure, mask handling, wafer metrology, etc). Due to the ambition to add more information, the ability to extend/adapt/customize the visualization tool seems beneficial. Stand-alone solutions can be prototyped on a laptop and can read standard ASML event log files. These files contain “linked events”, timing information, information about which part of the system reported each event, and textual descriptions of the events.
An additional application of this viewer might be to get an overview of a factory containing a dozen or so ASML wafer scanners controlled by a central host computer. The systems may be considered to behave independently, so no visualization of interdependencies is needed.
