Random Forest Visualization
Facts
| Type | master project |
|---|---|
| Place | internal |
| Supervisors | Michel Westenberg |
| Student | Natalia Kuznetsova |
| Thesis | download |
| start/end date | - 9/8/2014 |
Abstract
Classification is the process of assigning a class label to an observation based on its proprieties or attributes. A classification algorithm is applied to a data set, producing a model. By studying the model, insights about the data set structure can be gained. The benefits that a model can bring depend on the model. In this work, a Random Forest model is used for the analysis of data. A Random Forest model is explored by means of visualization. The results include this report and the prototype of a visualization analysis tool.
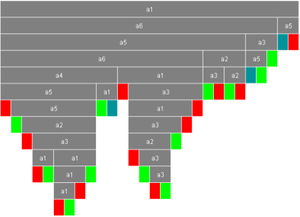
The tool, named ReFINE for Random Forest INspEctor, consists of several visualizations for a Random Forest model. ReFINE provides visualizations for Random Forest components - trees, and its special feature: proximity measure, variable importance, interactions and prototypes. Each of these aspects is presented with a different visualization technique; all the visualizations are integrated together to show the connections between them and allow a user to discover patterns in data sets. The effectiveness of the approach is validated with various data sets, including generated and real data.
As a result, ReFINE allows to investigate data, its most importance variables, theirs split points, connection between instances and their distribution.
