PAGE UNDER CONSTRUCTION
Facts
| Type | Master project |
|---|---|
| Place | Internal |
| Supervisor | prof.dr.ir Jarke J. van Wijk |
| Student | J.H.T. Claessen |
| start/end date | March 2010 - January 2011 |
| Thesis | Visualization of Multivariate Data |
Abstract
The ability to connect computers to one another, by means of a network, has led to computers being more vulnerable for malicious behavior. Network operators have the task to prevent attackers from performing malicious activities on their networks. In this thesis we present an extension to visualization techniques, providing added value for displaying network monitoring datasets. The resulting visualization technique is suitable for displaying multivariate data in general, hence not only applicable to network monitoring dataset.
The main enhancement made to the existing visualization techniques: flexibility, allows for layouts enabling the user for easier and quicker identification of dataset characteristics, structures and outliers. We present cases for several datasets where the introduced idea proved valuable, as well as an interface capable of supporting the suggested visualization technique. The user study proved that the presented idea of Flexible Linked Axes is considered useful. The visualization technique provides a solid base for dataset exploration and investigation, and gave new insights to network monitoring experts during the investigating of their datasets.
Description
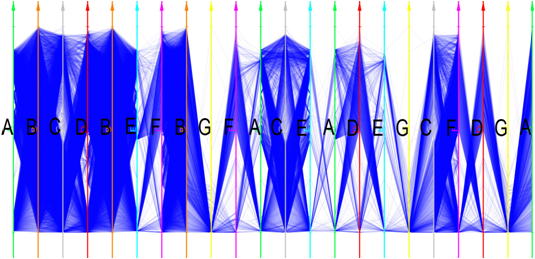
Although this project started as visualization of network monitoring data, it quickly became clear that the dataset could be interpreted as a generic dataset, hence multivariate data visualization techniques could be used. Multivariate data visualization is an area where a lot of research already has been conducted. After comparing existing visualization techniques to a list of requirements, two most promising techniques: Parallel Coordinate Plots And Scatter Plot Matrices where selected.
User interest
We argue that a user investigating multivariate data is primarily interested in two things: A) Attribute value distributions: attributes; B) Pairwise relations between attribute value distributions: attribute relations.
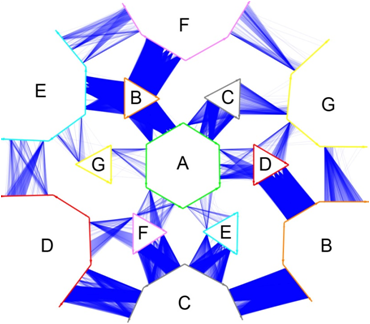
These two aspects are the base elements for the user’s interest. The user can be interested in combinations of those elements. To reason about this, we can present the current interest of a user as a graph, where nodes represent attributes and edges represent the attribute relations between the nodes.

Flexibility
With the flexibility option we keep the advantages from the original techniques while being enabled to:
- Unordered List Item Increase flexibility;
- Unordered List Item Improve orientation;
- Unordered List Item Improve the visualization;
- Unordered List Item Improve readability;
- Unordered List Item Improve space usage;
- Unordered List Item Add meaning.
Impressions
Usage methods
The user study showed that there are three ways

