Finished projects
This page links to descriptions of finished (master) projects conducted at the visualization group in the period 2010-2015. Projects listed here after that period are the ones supervised by Huub van de Wetering.
Projects before 2011 can be found here.
Projects after 2016 can be found at the master projects pages.
2016
Finding "Memphis" : a rating-based player comparison visualisation
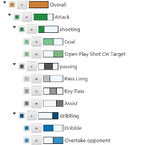 We designed and implemented a prototype visualization tool to compare the performance of foot- ball players. We introduced the interactive weighted attribute tree to make abstraction levels attribute that can hide the detail of the rating system and give the user the flexibility to build or modify their own rating system at run-time. To find similar players, we implemented automatic weight generation for a certain player to build a specific rating system to find similar players. In addition, we designed a player similarity graph, which combines the advantage of scatter plots and stacked bar charts. The user can easily locate a group of similar players and make selections for further comparison. For player comparison, we designed a player performance treemap that can compare players with player block size, order or color. We also designed a player comparison view to help the user compare all the visualizations appeared in the tool to make the final conclusion on which players are the better ones.
more
GPU-Accelerated Geodesic Fiber Tracking for HARDI Data using CUDA
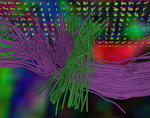 In order to non-invasively investigate white matter tracts in a human brain,
Diffusion Weighted MRI (DW-MRI) is used as a method to measure water molecule
diffusion. Diffusion patterns give information on tissue structure, such as
local white matter fiber direction. Many fiber tracking techniques have been
introduced to reconstruct the neural tracts from this DW-MRI data. Multi-valued
geodesic fiber tracking computes fiber paths as shortest paths through a curved
space. While this technique supports complex fiber structures, it suffers from
poor performance. We therefore designed and implemented a highly-parallel
variant of the geodesic fiber-tracking algorithm using the CUDA language as a
plug-in for the vIST/e tool. more
Software Events Visualization for TechUnited Football Robots
 To fully understand the brain, it is necessary to have knowledge of the brain anatomy and connectivity. Brain connectivity has a direct relation with anatomical structures. i.e, grey matter parcelation or white matter tracts. Magnetic Resonance (MR) Diffusion Weighted Imaging (DWI) is commonly used to extract information about the structural connectivity and the morphology of white matter tracts.
more
2015
Medication Visualization And Cohort Specification
Kempenhaeghe is an expertise centre for epileptology, sleep medicine, and neurocognition. Doctors gather information about epilepsy patients in order to respond with adequate surgery and/or medication. Per pa- tient, all data on symptoms, treatments, events and notes are stored in an information system in the form of a record that is known as an Electronic Health Record (EHR). These records ease the monitoring of theprogress of the patient over time. Since the records are stored textually, however, both the effectiveness and efficiency of the process of gathering deep(er) insight leave much room for improvement. This holds for a doctor working with the EHR of a patient and also for a clinical researcher studying the EHR data of cohorts of patients. more
Interactive Visualization of Event Log of Medical Imaging System
Philips Healthcare produces various types of medical imaging systems, such as X-ray, Computed Tomography (CT) and Magnetic Resonance (MR) Imaging. A high reliability and availability of these devices is of utmost importance. For the latter, it is important that the root cause of a failure can be identified quickly. Philips has already been working on researching large data analytics methods as finding failure patterns and predictive models such that the root cause of a failure can be identified faster and future failures might be predicted and prevented. more
Visual Exploration of Segmentation Errors in Pelvic Structures
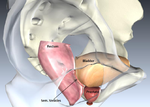 One of the most common treatment techniques of prostate cancer is radiotherapy. In radiotherapy, tumorous tissues are irradiated with a high dose, while the adjacent healthy tissue is preserved. Therefore, high accuracy is required during treatment planning.
more
Brain Connectivity
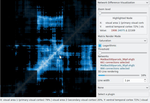 To fully understand the brain, it is necessary to have knowledge of the brain anatomy and connectivity. Brain connectivity has a direct relation with anatomical structures. i.e, grey matter parcelation or white matter tracts. Magnetic Resonance (MR) Diffusion Weighted Imaging (DWI) is commonly used to extract information about the structural connectivity and the morphology of white matter tracts. With the DTITool DWI data can be interactively and visually inspected.
more
Sport data visualization
 This project is concerned with the visualization of sport data, and especially football data.
Currently, only 90 matches from the Bundesliga 2 in 2007-2008 are available.
The data is provided by Opta, an English company specialized in gathering sport data. Opta is not a formal participant in this project, but they promised to provide feedback on request. Also, they have means to provide feedback from domain experts. The main target of the project is to make the data in the datasets accessible via suitable interactive visualizations. The target audience for the visualizations will initially be football enthousiasts.
more
High intensity focussed ultrasound toolkit (HIFUtk)
Recent studies have demonstrated the feasibility of High-Intensity Focused Ultrasound (HIFU) therapy for bone metastases by ablating the source of pain. Adoption of this new technique relies on the ability to measure and simulate the temperature and ablated tissue with high accuracy. For therapy of soft tissue this is measured directly using Magnetic Resonance Imaging (MRI), however this is not possible inside bone. Because of this the therapy is simulated using software to determine the local temperature and corresponding ablated region. more
Generating procedural skin textures
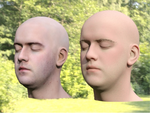 The videogame- and animation industry have a desire to create convincing virtual characters. Convincing virtual characters need convincing skin textures. The current two methods of creating skin textures, namely by scanning a real actor or by drawing them by hand, are both expensive and time consuming.
Our goal is to provide an alternative to these methods. We propose to let the artist indicate roughly how a character should look and then let the computer fill in all the details. more
2014
Sport visualization
 This graduation project aims to visualise sports data (football) for the upcoming World Championship football in Brazil, 2014. The research focuses mostly on non-spatial data. The goal is to visualise the core of a football match and to show it in a historical perspective.
more
Visualization of Diagnostics Data Sets
 ASML is a leading supplier of lithography equipment for the semiconductor industry. ASML's wafer scanners are complex systems involving nanometer-accuracy optics and mechatronics, as well as significant amounts of software and real-time control. Software in each machine records the machine's operations (including numerous warning and errors) in a so-called Event Log. The scanners are networked and the event log data is automatically sent to ASML's headquarters (for hundreds of machines throughout the world). A log typically collects hundreds of events per hour - even if the machine is operating perfectly. Diagnostics of downtime in the field largely relies on a field service engineer who relies on manual inspection of the event log: the field service engineer is expected to diagnose most machine failures using the event log and using an online knowledge base.
more
Random Forest Visualization
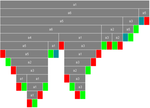 Classification is the process of assigning a class label to an observation based on its
proprieties or attributes. A classification algorithm is applied to a data set, producing a
model. By studying the model, insights about the data set structure can be gained. The
benefits that a model can bring depend on the model. In this work, a Random Forest
model is used for the analysis of data. A Random Forest model is explored by means
of visualization. more
City Traffic Visualization
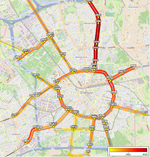 Sooner or later every modern city faces the challenges to cope with increased traffic and street congestions. Increased e-commerce means an increase in the number of delivery trucks driving around. Understanding how a city works can be used by researchers and governments to enforce new policies for regulating the traffic. Because of this, cities are pioneering with creating measuring sites that collect traffic data for further analysis.
more
Visualizing Flows in Event Logs
 Events and processes are logged at many places nowadays, websites tracking users, hospitals tracking patients and doctors, businesses tracking processes, schools tracking students, etc. However, because of the large volume of such data sets, it is not easy to analyze.
In cooperation with MagnaView, we developed a system called Event Log Flows, which allows the user to easily answer specific questions about the data.
more
2013
Accurate and Efficient Continuous Collision Detection
 In the last decades, interactive simulation has gained popularity in many fields.
Whether it is interactive simulation with respect to gaming or interactive sim-
ulation with respect to space simulation, an interactive simulation system will
most likely require some form of collision detection. Another field which also
benefits from collision detection is robotics. A collision detection system can be
used to assure that a planned motion of one or multiple robot arms is collision
free.
more
Interactive composition of metabolic pathways
 Metabolic pathways describe important chains and cycles of chemical reactions that occur in organisms. Individual pathways are easy to interpret because they are small, but do not always contain all reactions that are of interest to a biologist. Composing multiple pathways in an interactive, animated setting enables biologists to analyze metabolic processes that span multiple pathways. more
Analysis and Visualization of Medication Patterns
Kempenhaeghe is an expertise center on epilepsy, sleeping disorders and neurocognition. Researchers have collected data on medicine use from a large number of epilepsy patients. There is a need to obtain insight into medication patterns. Interactive visualization is a promising direction to this end. The data have to be presented such that experts are enabled to derive hypotheses and evaluate these. more
Cardiovascular blood flow: comparing measurement and simulation
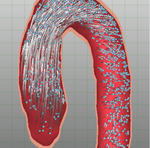 In the cardiovascular field, Magnetic Resonance Imaging (MRI) is
increasingly used in healthcare, to obtain non-invasive anatomical
patient-specific images. In addition to anatomical images, MRI can be
used to evaluate the blood flow within the cardiovascular
system. Time-resolved 3D phase-contrast (PC) MRI provides a technique
to measure blood flow in three directions at multiple time steps
during the cardiac cycle. The acquired PC-MRI blood-flow data is
expected to be able to diagnose several cardiovascular diseases
(CVDs), and is therefore of great relevance to physicians. With
typically twenty measurements per cardiac cycle the data is relatively
coarse in the temporal domain.
more
2012
Markerless GPU Accelerated Augmented Reality on Android Devices
This thesis describes an Augmented Reality (AR) framework for Android devices. Using the framework, virtual three dimensional objects are drawn in a view of the world captured with a camera, thus augmenting the reality. AR can for example be useful for visualisation or to assist with tasks. To enable a wide range of applications, the AR framework is developed for Android devices and designed to work in a wide variety of scenes. more
Contraction-based Curve skeletonization of 3D Meshes
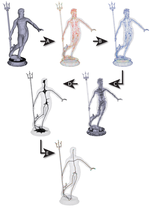 In this thesis, we present a framework for extracting high-quality curve skeletons from
3D meshes. For this, we propose one novel method and two others that are improved
versions of two state-of-the-art methods. In our main method we utilize surface skeletons
as an intermediate stage and investigate if this addition improves the quality of the final
curve skeletons. For judging their quality, we build a set of criteria, which is then used
to compare the results of relevant methods. Our framework extracts curve skeletons
which are more detailed, better sampled, smoother and (in most of the cases) better
centered. The extraction process is also insensitive to surface noise and small changes in
parameters. We also propose an idea for a novel application area for curve skeletons and
describe the current progress towards building this new framework and future plans.
more
A Layout algorithm for workflow nets
 In the Architecture of Information Systems (AIS) group a process mining tool, called ProM, is being developed. Within ProM Petri nets are used. A Petri net is a mathematical model of a process. It is a bipartite graph with weights on both the edges and nodes. It is also hierarchical in the sense that a node may actually be a sub network.
A layout algorithm for Workflow nets, a specific type of Petri net, is presented.
While much research has been performed on layout algorithms for graphs,
there is little known research on layout algorithms for WF-nets. Our layout algorithm
is an extended version of the Sugiyama algorithm combined with the Murata reduction
rules. We formulate a number of aesthetics that define a good layout.
more
Illustrating the Genus of a Seifert Surface
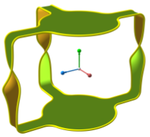 A Seifert surface of a knot ∗ is an orientable surface whose boundary coincides with that knot. These surfaces are named after Herbert Seifert, who gave an algorithm to construct such a surface from a diagram describing the knot in 1934. The steps in this algorithm are relatively easy to understand, this does not hold for the geometric shape, which does not become immediately apparent from the resulting schematic diagrams of the surface. Texts on knot theory almost always only contain these schematic drawings, from which it is hard to understand their structure and properties. Seifert also introduced the notion of the genus of a knot as the minimal genus of all Seifert surfaces of this knot. In this way the genus of a knot or link can be defined via Seifert surfaces. The aim of this project is to illustrate the genus of a Seifert surface by gradually transforming the surface to a normal-form that clearly shows the genus.
more
Migration Visualization
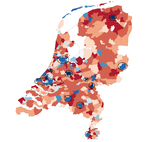 Demographic experts at CBS are interested in migration. Currently, analysis of migration data is a time-consuming process. The migration data set contains both information about the regions between which people migrate, and the migrants themselves. A combination of existing, easy to interpret visualizations is used to get insight in the data and speed up the exploration and analysis of migration data.
more
2011
A hybrid level-set method on the GPU
Historically, there have been two approaches to tracking evolving interfaces: Lagrangian and Eulerian. While it is difficult to track an interface that changes topology using a Lagrangian approach, the Eulerian approach handles such cases with ease. Unless expensive high-order finite differencing schemes are used however, the Eulerian approach exhibits what is observed as a loss of mass. These orthogonal strengths and weaknesses of the Lagrangian and Eulerian approaches have lead to an interest in a third, hybrid approach. more
Improving Business Intelligence Usage by Socialization
Business Intelligence tools are used by professionals to obtain knowledge about their organization to make better decisions. One type of such BI tools use visualizations to make understandable and insightful images of the organization's databases, an example of which is MagnaView WebLive. Although first time users see the value of such systems, field reports show that the tools can be used better. more
Fast Radar Simulation
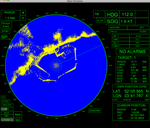 The screen of a radar system is complicated and subject to many
artefacts. Many physical aspects of the world need to be simulated in
order to faithfully reproduce it. In this thesis we introduce an algorithm
that can output a realistic image of a radar screen and update it in
real-time. This algorithm is designed to take advantage of the graphics
hardware to allow for real-time simulation.
more
Analysis of 3D MRI Blood-Flow Data using Helmholtz Decomposition
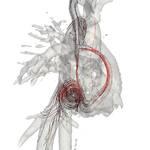 We present a method for obtaining a simplified representation of the blood-flow-field, acquired by Magnetic Resonance Imaging (MRI). The blood-flow provides an indication of the condition of the blood vessels and the cardiac muscle. However, the images acquired by MRI provide large and noisy data sets, which are hard to interpret. To facilitate the analysis of the unsteady blood-flow data, we aim for simplified and abstract representation of the velocity fields.
more
Visualization of Dense Temporal Events
Time plays a huge role in our lives. We use our understanding of time to determine when an event occurs, to place events in sequence after one another, and to compare how long events last. An event is defined as something that takes place in time; and each event has a duration associated with it, and occurs between different entities. For example, bank transactions across accounts, air traffic across airports etc. Events tend to accumulate over time, and examining them becomes rather tedious. Creating a visualization of these temporal events makes it easier to understand the patterns of interaction that these events weave over time. more
Visual Traceability across Dynamic Ordered Hierarchies
 Traceability is important in many scientific and industrial fields for verification purposes, accountability and quality control. Currently existing methods for gaining insight in traceability information cannot provide a complete overview and lack the ability to quickly gain insight in the relations between various items across multiple artifacts. We present a new method for visualizing traceability information within time-varying interrelated, hierarchically organized data such as documentation or source code.
more
Optimized user interaction in ARGOS through 3D visualization
ARGOS is a software product developed at FEI Company whose aim is to provide functionality for the analysis and visualization of three dimensional electron microscopy data sets. At the heart of ARGOS is a 3D template matching algorithm that finds the location and orientation of objects of interest inside the data. more
Interactive Construction, Analysis and Visualization of Decision Trees
Decision trees are models used for the classification (prediction) of data. These models are traditionally automatically constructed. We present a system for the interactive construction and analysis of decision trees that enables domain experts to bring in domain specific knowledge. more
Visual Interactive Grouping: Follow the Leader!
 Nowadays, data is collected almost everywhere and many of today's problems are data related.
To gain more insight in that data, or to find specific patterns, data may need to be grouped.
Current grouping systems encounter problems when coping with data contained in multiple tables.
more
Visualizing business process performance
The main goal of business process performance analysis has always been to analyze the performance of business processes in order to improve them. Studies on the topic have been focused mostly on obtaining the appropriate information from a process, while somewhat neglecting the way in which to provide it to the end-user. In this case proper visualization of the information can help to identify problems in the process or how and where to improve it. more
GUI for the Pilot station of an Unmanned Aircraft System
 The pilot station is used to control an UAS. It consists of different software and hardware components (e.g. navigation software, input devices, displays and transceivers). The station already has software that is used for controlling the UAS, however it needs to be enhanced with additional software in order to display aircraft related information.
more
Cartographically Inspired visualization of Point Sets
 The display of a large number of points, distributed over the plane, is a
classic visualization problem. Available space is usually limited, which means a
simple plot of the points (known as a scatter plot) quickly becomes cluttered
and also suffers from problems such as overplotting. An alternative solution is
the density plot, which depicts point density, visualized using color or
elevation in a 3rd dimension.
more
Augmented Reality for Landscape Development on Mobile Devices
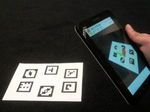 Mobile Devices, such as smart phones, are becoming more powerful in terms of processing power. This enables a new field in mobile applications, Augmented Reality (AR). AR combines the view of reality with virtual worlds in real time, which creates an immersive illusion that both worlds are as one. For this, localization, based on camera vision, plays a big role, since the virtual world has to be precisely placed in the camera image.
more
Visualization of Multivariate Data
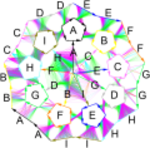 The ability to connect computers to one another, has led to computers
being more vulnerable for malicious behavior. Network devices are able
to collect information about the network traffic. Visualizing the network
traffic is a way to aid network administrators to keep their networks clean,
since algorithms have their shortcomings. We present an extension to
existing visualization techniques, providing added value for displaying
network monitoring datasets. The proposed result is suitable for displaying
multivariate data in general. The main enhancement made to the existing
visualization techniques: flexibility, allows for layouts enabling the
user for easier and quicker identification of dataset characteristics,
structures and outliers. We present several scenarios and the results
from a user study to investigate the feasibility of the proposed solution.
more
2010
GPU-based density plots
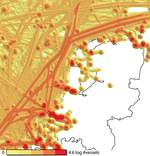 In this project we have concentrated on optimizing and extending previous work on vessel density plots. Our main contributions are two-fold. First we reduce the computation time of the density map significantly using the parallel computational power of modern graphics hardware. And second, we introduce several visualization techniques intended to find patterns and correlations between different parts of the data set based on quantities such as time or velocity. Due to the speed increase we achieve using dedicated graphics hardware, we enable direct interaction on the visualization by changing the parameters of the density map computation and the visualization.
more