Old internal projects
Teeth and Gums modeling using medial representations
Oral healthcare is an active area of research in several fields such as orthodontic teeth alignment to novel applications for teeth cleaning. Philips is active in development of new consumer devices allowing users to improve and maintain their oral health. For this assignment we aim to develop new methods and algorithms to segment 3D high-resolution surface models of teeth and gums into the individual teeth and the gum area. more
Gene regulatory network visualization
 A gene regulatory network describes interactions between genes. This network can be represented by a graph in which the nodes represent genes, and the edges represent the interactions. These graphs have specific properties that make it hard to draw them nicely.
more
A gene regulatory network describes interactions between genes. This network can be represented by a graph in which the nodes represent genes, and the edges represent the interactions. These graphs have specific properties that make it hard to draw them nicely.
more
Smoothing surfaces under constraints
Many approaches are available to smooth surfaces. But it is unclear how to smooth surfaces where part of the geometry is fixed. Given a triangle mesh, where for instance the boundary and a number of interior points are fixed, how to perturb the remaining vertices (and possibly adapt the mesh) such that a smooth surface results? more
Photorealistic Scatterplots
A scatterplot is a standard and useful graphic display. The two axes denote different variables, other variables can be shown via the color, shape, or other properties of the symbols used. Standard scatterplots (such as those of MS Excel) look somewhat boring and abstract, whereas in modern user interfaces 3D elements are used more and more. more
Spatio-temporal Visual Analysis of Business Process Executions
 This master project focuses on devising and developing a tool to allow for analytical reasoning of the past execution of business processes. The process of reasoning will be supported by interactive graphical interfaces that provide several visual representations of the process execution and data. In particular, the tool is aimed to exploit the map metaphor. Each visual representation is represented by a map, a simple flat image, which may be a geographic map(e.g., a map of a factory or an office), a Gantt chart, an organizational diagram, social networks and several more. Dots represent the performed activities and are placed in meaningful positions: e.g., on a geographic map activities are placed where they were executed or on an organization diagram the role of the activity executor. The tool will rely on the concept of “activities’ replay”. It consists in analysing the execution log and, thus rebuilding what occurred in the past. In this way, activities can be positioned as dots on the maps. Since during the activities’ replay, activities are started, carried on and out, dots are continuously appearing and disappears. That results in building a movie where each frame represents a visual representation in a certain moment in time. These frames are then merged together in order to obtain a movie. By playing the movie, process analysts becomes aware of the past executions and able to find issues and bottlenecks. Since the amount of data visualized can be by far huge, the tool should be able with an end-user support to aggregate some pieces of information and filter out what has little relevancy. more
Visualizing a mapping from event log elements to database elements
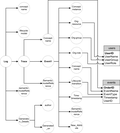 In the Architecture of Information Systems (AIS) group a data mapping tool, called XESame, has been developed. XESame allows a user to define a mapping from columns of tables in a database to elements of an event log (XES). Elements of an event log include instances of traces (e.g. objects such as a patient or an order), its related events (e.g. creation, confirmation, archiving), and data attributes which tell something about these objects (e.g. date and time, user who executed the action). This mapping is already visualized in XESame but especially for larger mappings (a tree of 30+ nodes related to 5-10 or more tables) the visualization is hard to read.
more
In the Architecture of Information Systems (AIS) group a data mapping tool, called XESame, has been developed. XESame allows a user to define a mapping from columns of tables in a database to elements of an event log (XES). Elements of an event log include instances of traces (e.g. objects such as a patient or an order), its related events (e.g. creation, confirmation, archiving), and data attributes which tell something about these objects (e.g. date and time, user who executed the action). This mapping is already visualized in XESame but especially for larger mappings (a tree of 30+ nodes related to 5-10 or more tables) the visualization is hard to read.
more