Jack van Wijk
Eindhoven University of TechnologyDept. of Mathematics and Computer Science
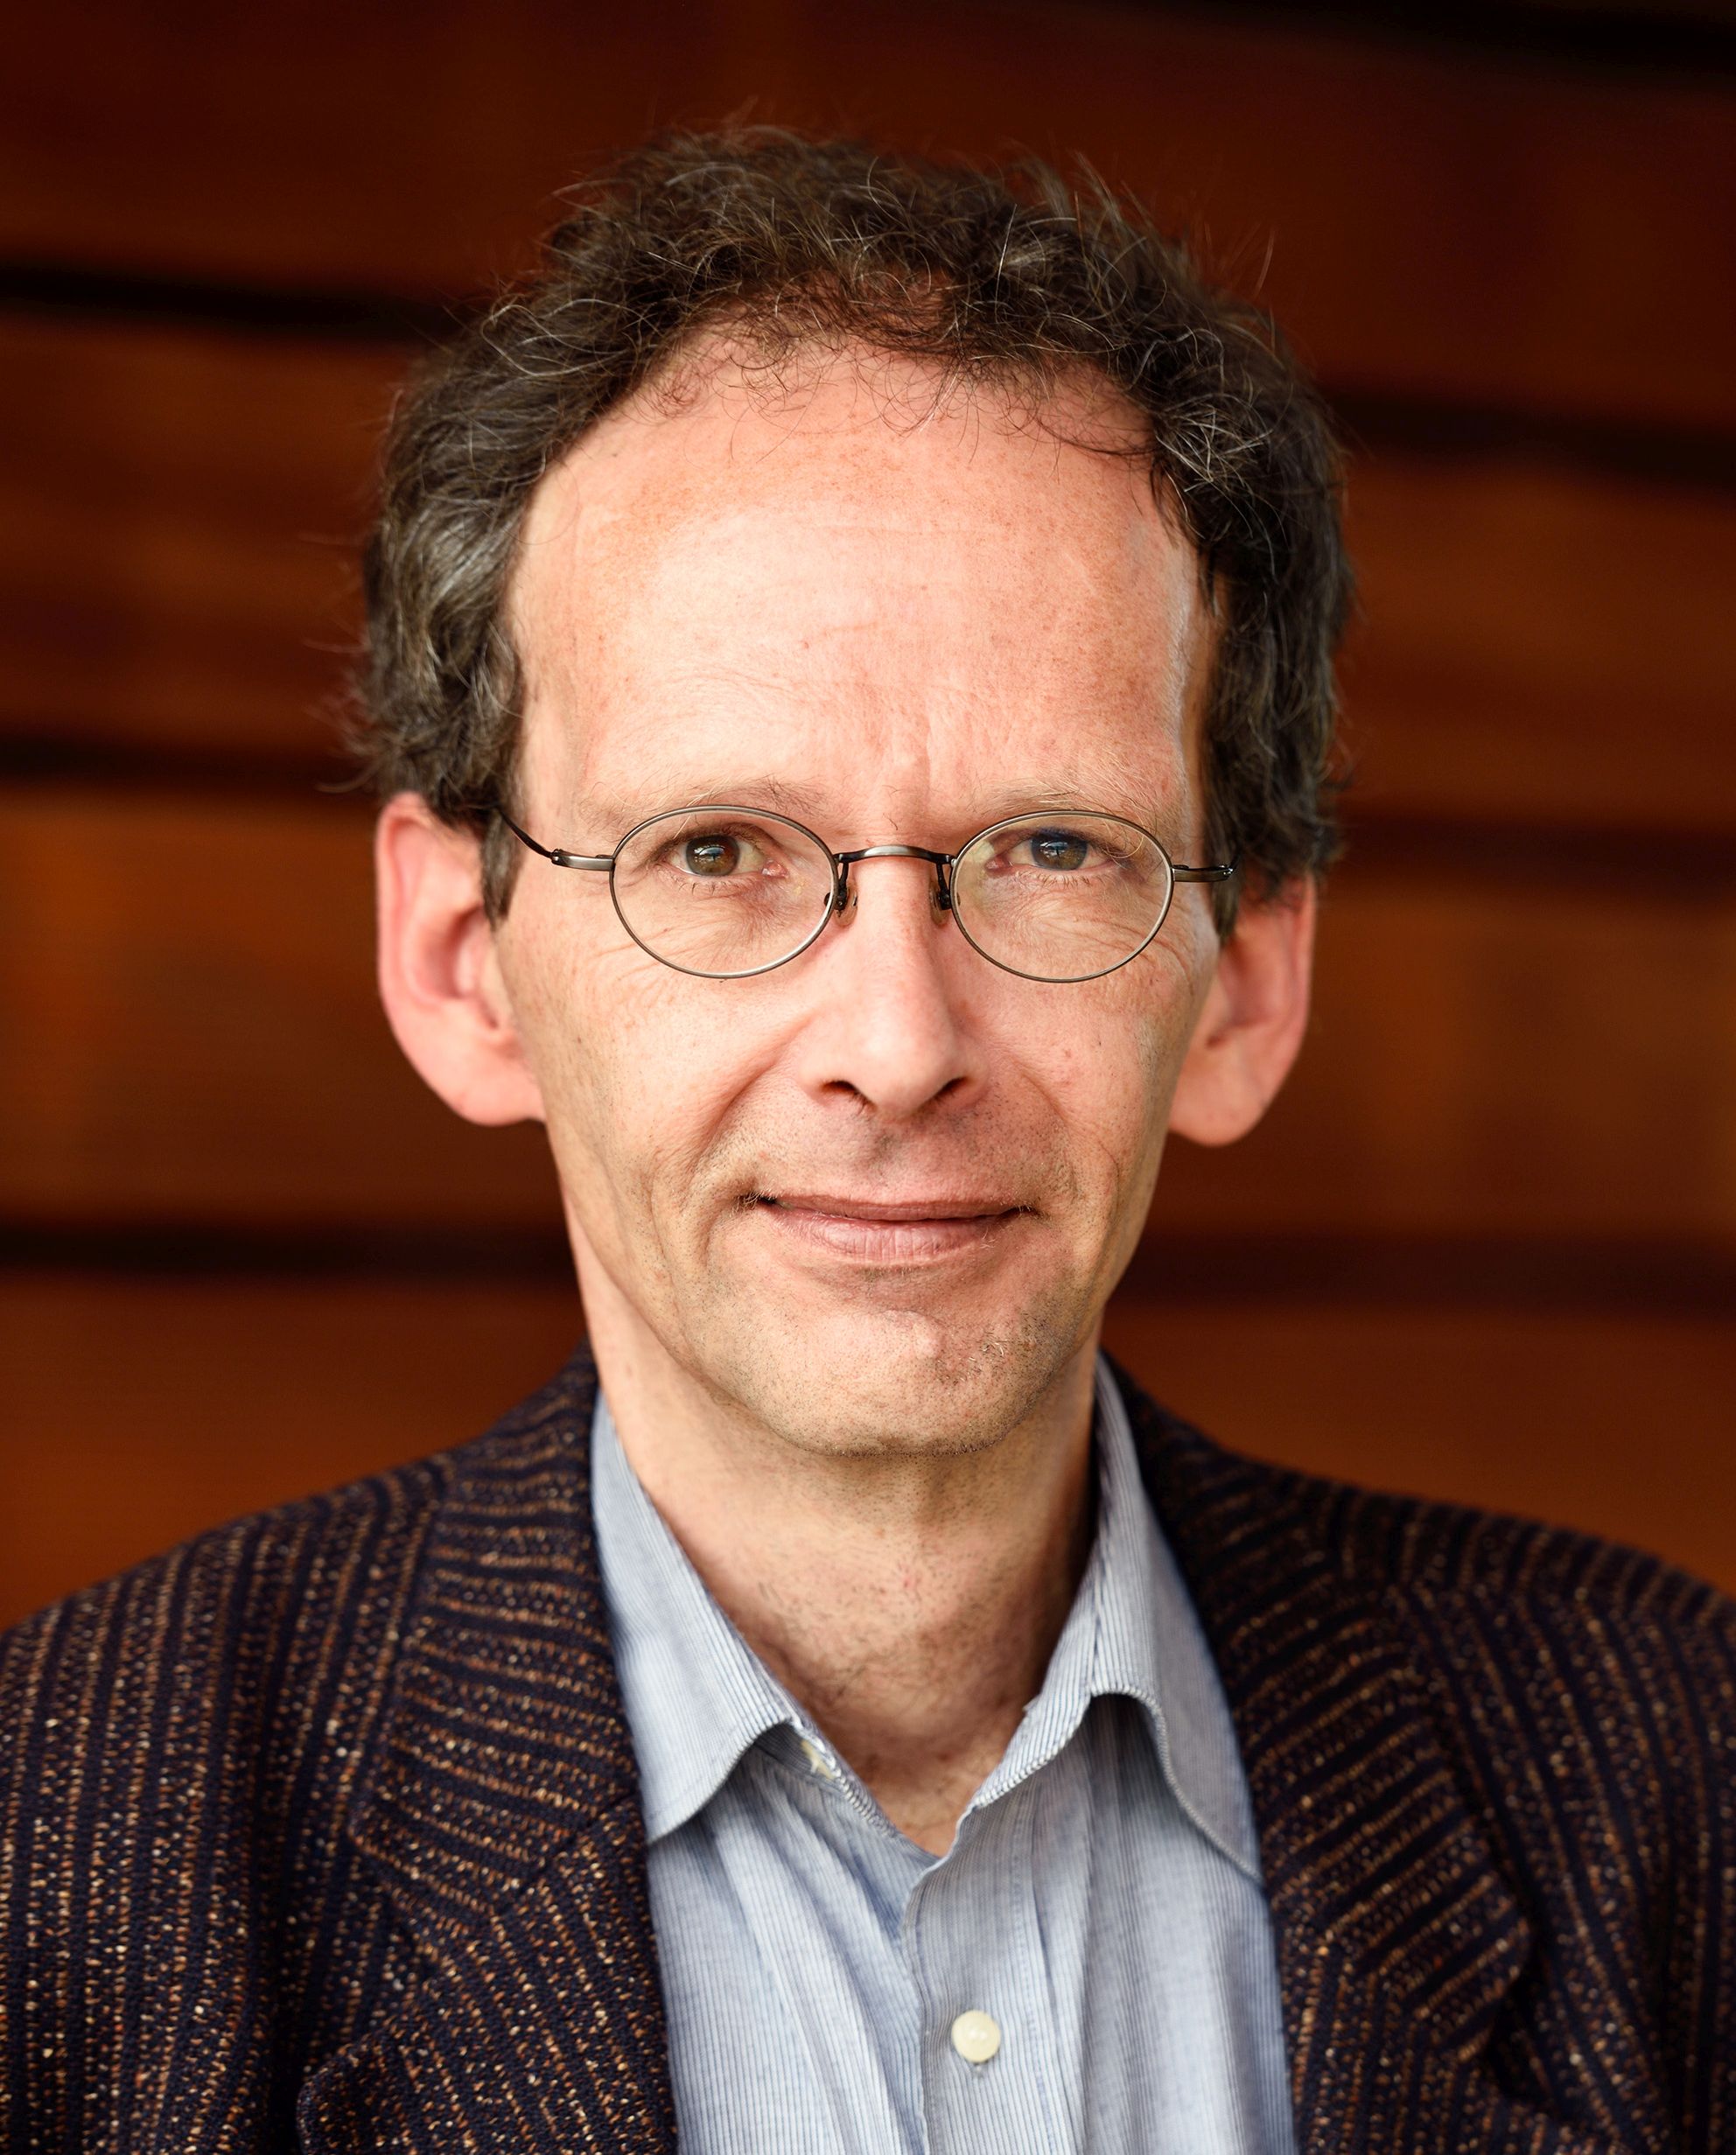 Photo: Bart van Overbeeke
Jack (Jarke J.) van Wijk [pronunciation] is full professor in visualization at the Department of Mathematics and Computer Science of Eindhoven University of Technology (TU/e).
He received a MSc degree in industrial design engineering in 1982 and a PhD degree in computer science in 1986, both from Delft University of Technology, both with honors. After a short period in the software industry, he has worked for ten years at the Netherlands Energy Research Foundation ECN. He joined Eindhoven University of Technology in 1998, where he became a full professor of visualization in 2001. His main research interests are information visualization, visual analytics, and mathematical visualization. He is cofounder and VP Scientific Affairs of MagnaView BV (now ProcessGold BV), another start-up from his group is SynerScope BV, and in 2018 AnalyzeData BV has started. He was scientific director of the Professional Doctorate in Engeneering (PDEng) program on Data Science (2016-2021), and scientific director of the Data Science Center Eindhoven (DSC/e, 2018-2021).
He has (co-)authored more than 150 papers in visualization and computer graphics. He has been paper cochair for IEEE Visualization (2003, 2004), IEEE InfoVis (2006, 2007), IEEE VAST 2009, IEEE PacificVis 2010 and EG/IEEE EuroVis (2011, 2016, 2017). He received the IEEE Visualization Technical Achievement Award in 2007 for his work on flow visualization; the Eurographics 2013 Outstanding Technical Contributions Award; and the VGTC Visualization Lifetime Achievement Award in 2021.
Furthermore, he received best paper awards at IEEE InfoVis 2003, IEEE Visualization 2005, IEEE PacificVis 2013, IEEE InfoVis 2014; IEEE VAST 2015, the 2009 Henry Johns Award of The Cartographic Journal, the IEEE InfoVis 2019 20 Years Test of Time Award, and the the IEEE Vis 2020 15 Years Test of Time Award. In 2019 he was inducted into the IEEE Visualization Academy. He was keynote, capstone, or invited speaker at PacificVis 2009, EuroVAST 2010, GD 2011, VMV 2011, i-KNOW 2011, Bridges 2013, IEEE VISSOFT 2013, IEEE VIS 2013 (video), VAHC 2015, ACM Multimedia 2016, VISIGRAPP 2017, Eurographics 2018, and Journée Visu 2019.
Google scholar
|
DBLP
|
Publications
Supervisor:
Co-supervisor:
INFODECODATA was an exhibition of the Graphics Design Museum in Breda,
the Netherlands, which lasted from February to September 2010. At INFODECODATA
various examples of my work were shown, including a large collection
of SequoiaView images of hard disks, myriahedral projections, flow
visualization and mathematical visualization.
MagnaView is a spin-off company based
on innovative technology from the visualization group. It provides
tools to visualize large tables in a variety of ways, where simultaneously
overviews as well as details are presented.
How to generate highly symmetric tilings of closed surfaces?
Such tilings are called Regular Maps, see
here for more info.
Presented at ACM SIGGRAPH 2009.
What happens if we map the earth by gluing a large number of small maps
together? Check out
myriahedral projections.
Given a knot, can you imagine an oriented surface bounded by that
knot? More info can be found
here.
Image Based Flow Visualization (IBFV) is a fast and versatile method for
the visualization of two-dimensional fluid flows. Animations of fluid flow
(textures, particles, etc.) are generated at 50 frames per second on standard
PCs with 3D graphics hardware. The 2D version of IBFV has been presented
at ACM SIGGRAPH 2002. More information can be
found here.
We have extended IBFV to deal with curved surfaces (presented
at IEEE Visualization 2003). More information can be found
here.
Research at TU/e has led to an innovative method for tree visualization:
Cushion Treemaps. For a practical application, see the SequoiaView
homepage. With SequoiaView you can get insight in the contents of an
entire hard disk within a few seconds.
A fast method to generate fractal imagery. More information can be found here.
An interactive solution for the exploration of large parameter spaces. More information can be found here.