2IV05 - additional component CG - 2012-2013 Q3
for previous versions see 2IV05
supervisor: Huub van de Wetering (MF 6.087, h.v.d.wetering@tue.nl),
Agenda
| week | task | day | date | place | student
deliverable
| | 1
| Introduction
| Tuesday
| 05/02/2013
| Aud13
| -
|
| 2
| Proposal submission
| Monday
| 18/02/2013, before 13h
| oase
| assignment proposal |
| Evaluation of proposals
| Tuesday
| 19/02/2013
| Aud13
| - |
| 3
| Submission I
| Thursday
| 28/02/2013, before 9h00
| oase
| report: concept, v1 |
| Presentation day I
| Friday
| 01/03/2013
| LaPlace 1.105
| presentation + demo |
| 6
| Submission II
| Monday
| 18/03/2013
| oase
| report: complete, v2 |
Presentation day II
| Tuesday |
19/03/2013
| Aud13
| presentation + demo
| | 7
| Review
| Tuesday
| 26/03/2013, before 17h
| oase
| - |
| 8
| Demo day
| Friday
| 05/04/2013
| LaPlace 1.105
| full demo in a
market setting |
Submission III
| Monday
| 22/4/2013
| mailbox @ MF6.209
| report: final, v3;
all other final deliverables
| | ?
| Final discussion
| ?
| ?
| MF6.087
| - |
Description
This assignment is created for improving the practical skills in creating
computer graphics and visualization applications.
Programming language and environment are at the choice of the student.
Procedure:
- Students work in groups of two persons and register as such in Oase.
In case of a small number of participants, this may be reduced to groups of one person.
- Each group chooses one of the assignments given below.
- Each group writes a proposal for the assignment.
The proposal should contain:
- global description of the system,
- specification of functionality, interaction, and presentation
- a planning
The total size of this proposal should be 4 to 6 pages.
The proposal should be emailed to the supervisor in pdf format.
The supervisor will respond to the proposal during the second meeting.
Typically responses are suggestions for addition or removal of functionality or
change in planning
If more than two groups choose the same assignment, the supervisor will reward
the groups with the best proposals, and ask the remaining groups to choose
a different assignment.
- The students start working on their assignments and
can consult the supervisors after making an appointment.
- Submission I: concept version of the final report, featuring sections and subsections
with an appropriate description of the intended content, or the actual content where that
is possible.
- Presentation day: each group gives a short, 10 minute, presentation about the project
and shows a running prototype illustrating the already implemented concepts. Clearly
explain requirements, state problems and their solutions, as far as feasible.
Care must be taken to state clearly the status of the project:
what is already finished, what still needs to be done, etc.
The supervisors will give feedback: on the project, the presentation (if necessary), and
on the concept report of submission I.
- Submission II: a complete report has to be submitted; see report requirements below.
The supervisor will review this report and notify the students of his findings.
- Demo day: Students present their results to fellow students and to a selection of
staff members of the visualization group.
- Submission III: final deliverables, including a change report wrt submission II. This change report should not only state
what has been changed in the report but also clearly state what the students did as a result of the review
they received before. See below for more remarks on deliverables.
- In a separate meeting the results and report are discussed with the supervisor (Optional).
final deliverables
- report and change report, submitted on paper.
- working program + sources + manual + snapshots to be supplied on CD or DVD.
It should be possible to easily test the program so good sample input is also required.
Report requirements
The report should contain the following elements.
- introduction/requirements
- analysis and solution: mathematics/algorithms/system design
- motivation of choices made,
- discussion of literature,
- results & evaluation, explicitly mentioning of known limitations
- conclusion and future work
The total size of the report should be about 10-15 pages.
Hint
Please give your application attractive and functional interactivity.
This will not only help you to develop and test your own program but, for sure, others will not
like your program, if you don't like it yourself. Both functionality and usability of the system
will be graded.
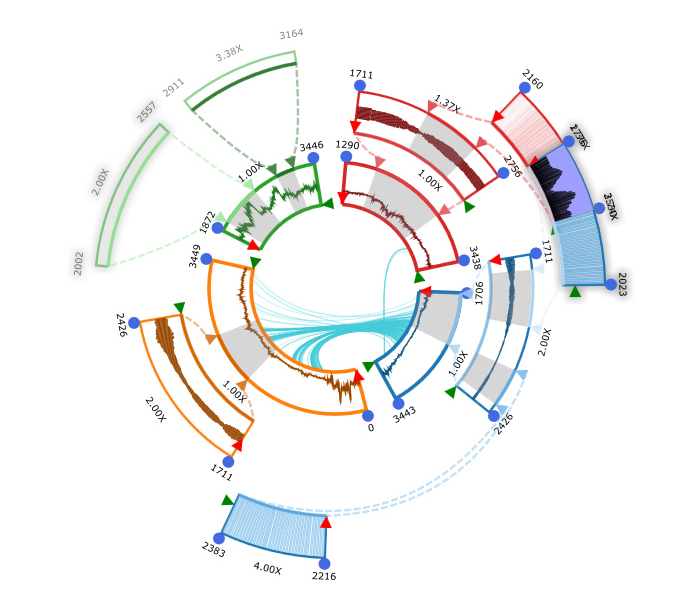
Assignments 2012-2013 Q3
1 ⊕ infovis toolkit battle
|
There have been several attempts to implement toolkits for information visualization. None of which
resulted in widely accepted solutions. Recently, two new, more generic, attempts have been made.
One, D3.js, which is data driven, and the other, JavaFX, attempts to support visualization and animation in so-called rich clients.
Ideally, this assignment is executed by two groups, one group that uses JavaFX and the other one that uses D3.js. Both groups try to make a version of the same (complex) infovis widget. A good example of such a widget is a time series visualization and analysis tool, called KronoMiner.
Additional information
|
|
2 ⊕ glider log viewer
With the advent of cheap and portable GPS equipment glider pilots started logging their flights in so-called IGC files. These files contain series of time-stamped locations (longitude, latitude, height). Some additional information is also available: a.o. pilot name, glider type, glider identification.
Some viewers for these log files exist. Some possibly new features should be designed and implemented.
Requirements for these features should be gathered in collaboration with two glider experts.
Some interesting features could be:
- simultaneous replay of glider competition tracks: During a glider competition a glider should go as quickly as possible from from A to B. However, they do not start at the same time.
- aggregate views: when a glider pilot flies in a new area, it takes some time to find spots and heights at which normally/often good thermals exist. An aggregated view of previous flights in the area could show him these spots.
- flight safety: some aspects of flight safety are: reachability of a good landing spot, minimal distance to certain areas?, minimal height?, etcetera.
This application could possibly be realized in combination with existing GIS systems, like Google earth or NASA world wind. Additional information resources, like weather reports, could be used.
Additional information:
2 ⊕ website visualization
Both visitor and developers of websites could benefit from a clear visualization of the structure of a webpage or a website.
They could use the visualization to build a mental map of the site and eventually feel more comfortable at browsing the provided
information. For website developers additional motivation might be that visualization might show flaws in the implementation or design of the web page. So, design and implement visualizations that support either a visitor or developer, or both, in appreciating or understanding substantially sized piece of web content.
Additional requirements could be:
- specializing your method for specific web content (e.g. time dependent data: news feeds, blogs, teletekst, ...),
- showing complexity, page structure, external linking, size, etcetera.
4 ⊕ point based rendering
Rendering highly complex models results in triangles whose projected area is less than a few pixels. Using standard scanline-conversion methods for the rendering of these tiny triangles becomes inefficient because of the necessary overhead for the triangle setup. Therefore, above a certain complexity, points are the conceptually more efficient rendering primitive. Holes in the rendered image (e.g. when zooming in) can be avoided by image-based filters, by adjusting the sampling density, or by so-called surface splatting. In this case each point is associated with a radius and a normal vector and therefore represents a small disc in 3-space, that is projected onto the image plane.
full description
5 ⊕ Hidden surface removal
Write a demo application for a completely self-developed hidden surface algorithm. Typical requirements used in this project are: high performance, large worlds, and dynamic environment. Additional tasks in this project are, for instance: complexity analysis, performance tests, and test scenes creation.
Care should be taken to support some degree of shading, and interaction.