To prevent spam users, you can only post on this forum after registration, which is by invitation. If you want to post on the forum, please send me a mail (h DOT m DOT w DOT verbeek AT tue DOT nl) and I'll send you an invitation in return for an account.
Analyze Transition System

Hi everybody,
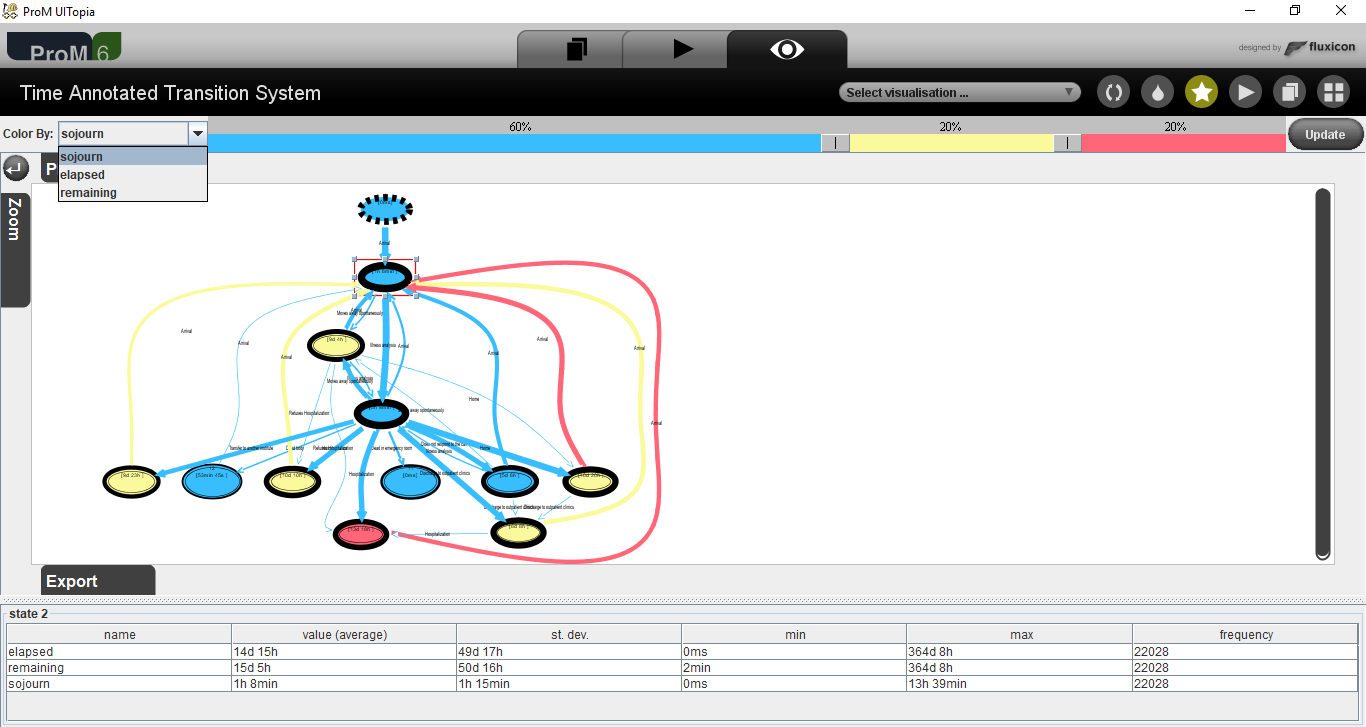
I must do some "performance analysis" on the transition system attached below, using the plug-in "Analyze Transition System", and I don't understand the meaning of several stuffs. In particular, I have the following questions:
1) Why the states are colored in different ways? What the colors are meaning?
2) What are the percentages on the top of the screen (60%, 20%, 20%)?
3) What is the difference between the three types of timing (the combo box on the top-left)? I mean "sojourn" time, "elapsed" time and "remaining" time
Thank you in advance")
I must do some "performance analysis" on the transition system attached below, using the plug-in "Analyze Transition System", and I don't understand the meaning of several stuffs. In particular, I have the following questions:
1) Why the states are colored in different ways? What the colors are meaning?
2) What are the percentages on the top of the screen (60%, 20%, 20%)?
3) What is the difference between the three types of timing (the combo box on the top-left)? I mean "sojourn" time, "elapsed" time and "remaining" time
Thank you in advance
Comments
-
Hi Talion,
Maybe these two papers can help:
http://wwwis.win.tue.nl/~wvdaalst/publications/p609.pdf
http://wwwis.win.tue.nl/~wvdaalst/publications/p599.pdf
Joos Buijs
Senior Data Scientist and process mining expert at APG (Dutch pension fund executor).
Previously Assistant Professor in Process Mining at Eindhoven University of Technology -
They are very helpful, thanks!
-
Hi,I have the similar questionWhat are the differences between service time, waiting time, elapsed time, remaining time and sojourn time. I can guess, but I am not sure about them.I tried to open the two given links, but those are not accessible for me.Would you please help me?Thanks in advance
-
Hi,Please use the following links instead:
- http://www.padsweb.rwth-aachen.de/wvdaalst/publications/p609.pdf
- http://www.padsweb.rwth-aachen.de/wvdaalst/publications/p599.pdf
(Wil van der Aalst has moved from TU Eindhoven to RWTH Aachen.)Kind regards,Eric.


Howdy, Stranger!
Categories
- 1.6K All Categories
- 45 Announcements / News
- 224 Process Mining
- 6 - BPI Challenge 2020
- 9 - BPI Challenge 2019
- 24 - BPI Challenge 2018
- 27 - BPI Challenge 2017
- 8 - BPI Challenge 2016
- 67 Research
- 994 ProM 6
- 387 - Usage
- 287 - Development
- 9 RapidProM
- 1 - Usage
- 7 - Development
- 54 ProM5
- 19 - Usage
- 185 Event Logs
- 30 - ProMimport
- 75 - XESame