Brain connectivity visualization
Facts
| Type | master project |
|---|---|
| Place | internal |
| Supervisors | Anna Vilanova (BMT), Huub van de Wetering |
| Thesis | download |
| Student | Rick Hendricksen |
| start/end date | May 2015 |
Description
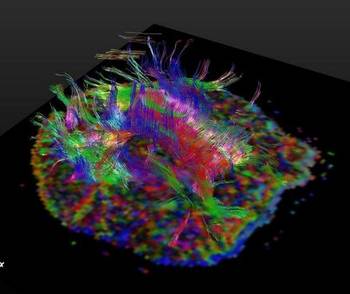
 To fully understand the brain, it is necessary to have knowledge of the brain anatomy and connectivity. Brain connectivity has a direct relation with anatomical structures. i.e, grey matter parcelation or white matter tracts. Magnetic Resonance (MR) Diffusion Weighted Imaging (DWI) is commonly used to extract information about the structural connectivity and the morphology of white matter tracts. With the DTITool DWI data can be interactively and visually inspected, see figure 1. DTITool shows fibers that are the result of tractography, the act of reconstructing the white matter connections based on the DWI data. Fiber tracts start and end in grey matter, and they define the structural connectivity matrix of the grey matter. Enormous connectivity matrices can be generated by modern state-of-the-art MRI scanners operating at field-strengths of 7T.
Visualizing connectivity graph data is of importance in evaluating their correctness, reliability and importance. Also since several different algorithms for tractography exist, comparing these algorithms by comparing the resulting matrices is of interest. The connectivity information stored in the matrices can be complemented by a hierarchical structure imposed on the rows and columns of the matrix. A connectivity matrix and a hierarchy together form a so-called compound graph.
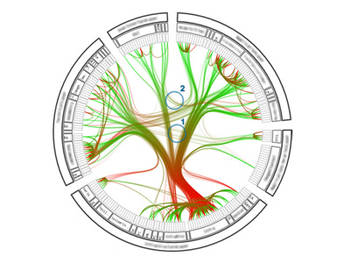
In software visualizations, compound graphs are formed by a call graph and a software module
hierarchy. Typical visualizations are a node-link diagram and a matrix view, both in combination
with some hierarchy view. See figure 2, where bundling is used to avoid clutter. Clutter is one of the problems that appears due to large number of nodes and edges.

Assignment
Create a visualization tool to show, to browse, to analyse, and to compare huge compound graphs. This tool must be applicable in the above sketched context of brain networks with thousands of nodes.
Coordinate systems on the grey matter (surface) exist. These coordinates might be used in the visualization, and they may appeal to a user's pre-existing mental map.
Large connectivity matrices with imposed hierarchies for brain networks are coming available from the faculty of psychology and neuroscience of Maastricht University[2]. Together with the biomedical image analysis group [3] of BMT, they provide the domain knowledge needed to build the required tool.
Additional information
- [1] DTITool of BMIA group
- [2] Cognitive Neuroscience/Neuroimaging, faculty of psychology and neuroscience, Maastricht university.
- [3] Biomedical image analysis group, BMT , TU/e.