Migration Visualization
Facts
| Type | master project |
|---|---|
| Place | external |
| Supervisor | Jack van Wijk |
| Student | Giel Oerlemans |
| Thesis | download |
| start/end date | 4/2012 |
Abstract
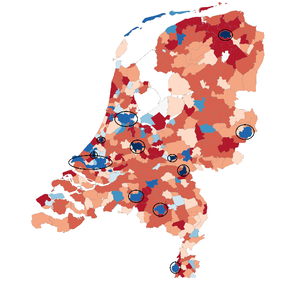
Demographic experts at CBS are interested in migration. Currently, analysis of migration data is a time-consuming process. The migration data set contains both information about the regions between which people migrate, and the migrants themselves. A combination of existing, easy to interpret visualizations is used to get insight in the data and speed up the exploration and analysis of migration data. Aggregation of the regions and filtering of the people are used to cope with the scale of the data. The user is enabled to interactively explore the data by using a familiar representation of a country: a map. Different graphs and a scatterplot show additional information about the inspected regions and the people moving in or out. A clustering algorithm is employed to seek for patterns in the data, by grouping similar regions based on attributes like age or income distribution, or by grouping them based on the migration data. A matrix visualization is used to analyze or validate the clustering. The implementation is demonstrated using migrations between municipalities in The Netherlands. Other types of flow data can be supported using minor adjustments. The targeted audience are experts in migration data analysis and demographics, to help with the analysis of migration data, but also any interested novice to the field.
