Visualizing a mapping from event log elements to database elements
Facts
| Type | master project |
|---|---|
| Place | internal |
| Supervisor | Joos Buijs (AIS), ? (VIS) |
| Student | - |
| start/end date | - |
| date | 12/2010 |
Description
In the Architecture of Information Systems (AIS) group a data mapping tool, called XESame, has been developed. XESame allows a user to define a mapping from columns of tables in a database to elements of an event log (XES). Elements of an event log include instances of traces (e.g. objects such as a patient or an order), its related events (e.g. creation, confirmation, archiving), and data attributes which tell something about these objects (e.g. date and time, user who executed the action). This mapping is already visualized in XESame but especially for larger mappings (a tree of 30+ nodes related to 5-10 or more tables) the visualization is hard to read. Furthermore, it would be very nice if the visualization could also be used to (partly) define the mapping by providing editor functionality.
For this assignment the student is asked to create a layout algorithm for XESame mappings by
- examining existing solutions,
- gathering requirements,
- designing an algorithm, and, finally,
- implementing this solution in XESame.
Additionally, editor functionality could be added to the visualization.
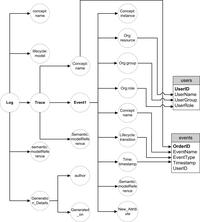
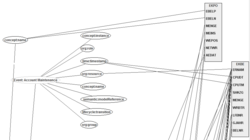
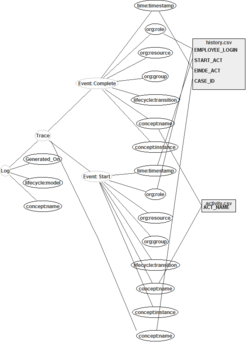
The figures below show visualizations of two case studies. The figure above shows a sketch of a new visualization.
Additional information
- http://www.processmining.org - information about process mining in general


