Gene regulatory network visualization
Facts
Description
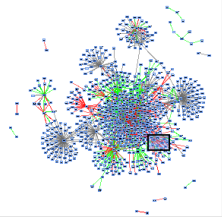
A gene regulatory network describes interactions between genes. This network can be represented by a graph in which the nodes represent genes, and the edges represent the interactions. These graphs have specific properties that make it hard to draw them nicely. Typical of these graphs is that a small number of nodes has a very high degree (200-300 outgoing edges). The majority of nodes has a low degree (up to 5). There are also many nodes that have degree 1 (they are just targets). Another typical aspect of these graphs is that there are two types of edges, because gene-to-gene interaction can be downregulating or upregulating. There is a third type of edge describing an unknown type of interaction, which means that the exact type of interaction has not yet been confirmed. A typical result created by a force-directed layout algorithm is shown in the picture.
The aim of this project is to improve the visualization of gene regulatory networks. Solutions could be sought in a new layout algorithm, a different type of graph representation, or combinations thereof.
