
Why Visualization?
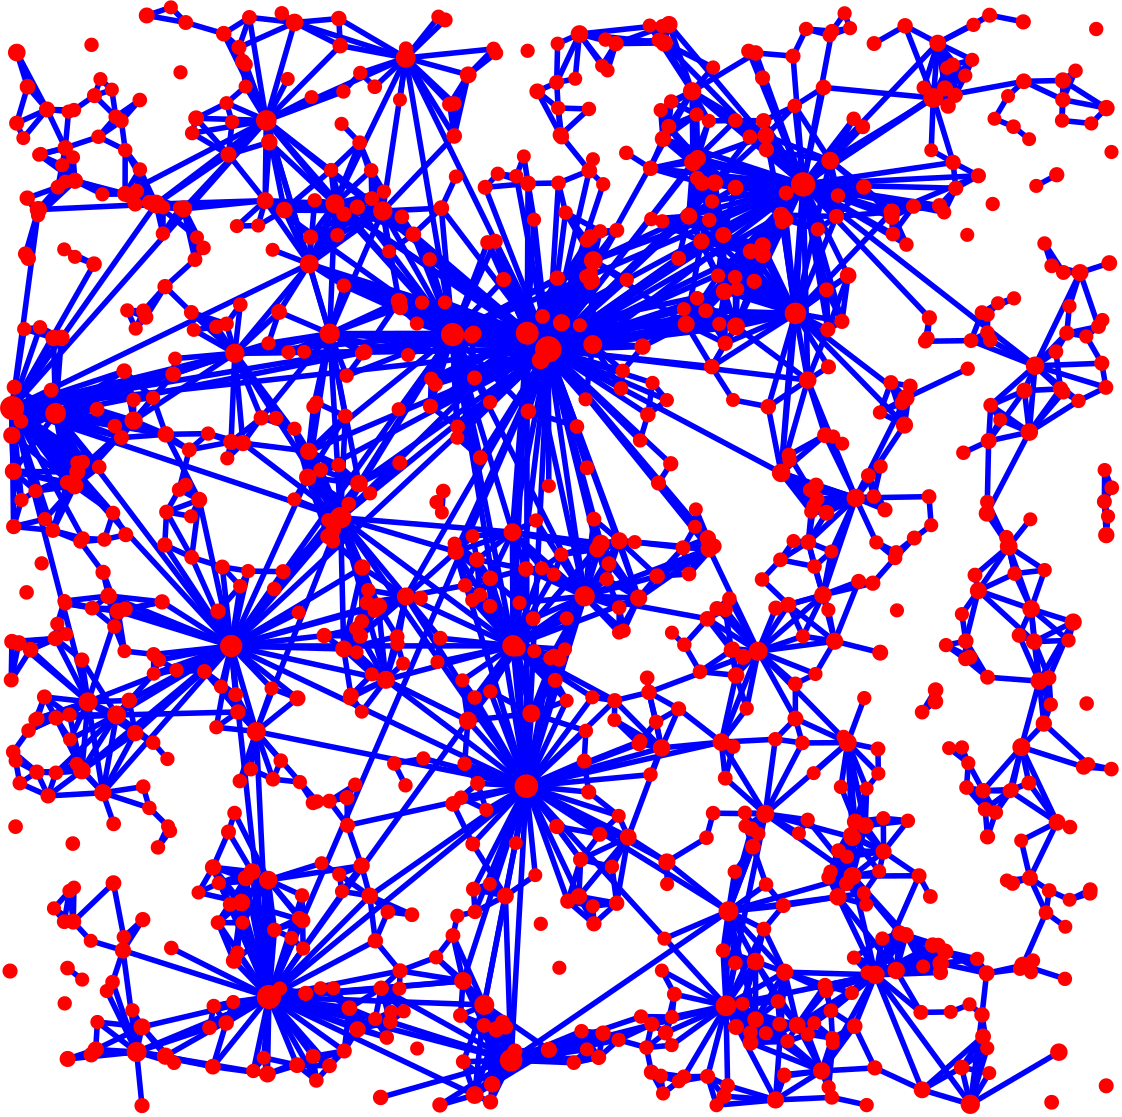
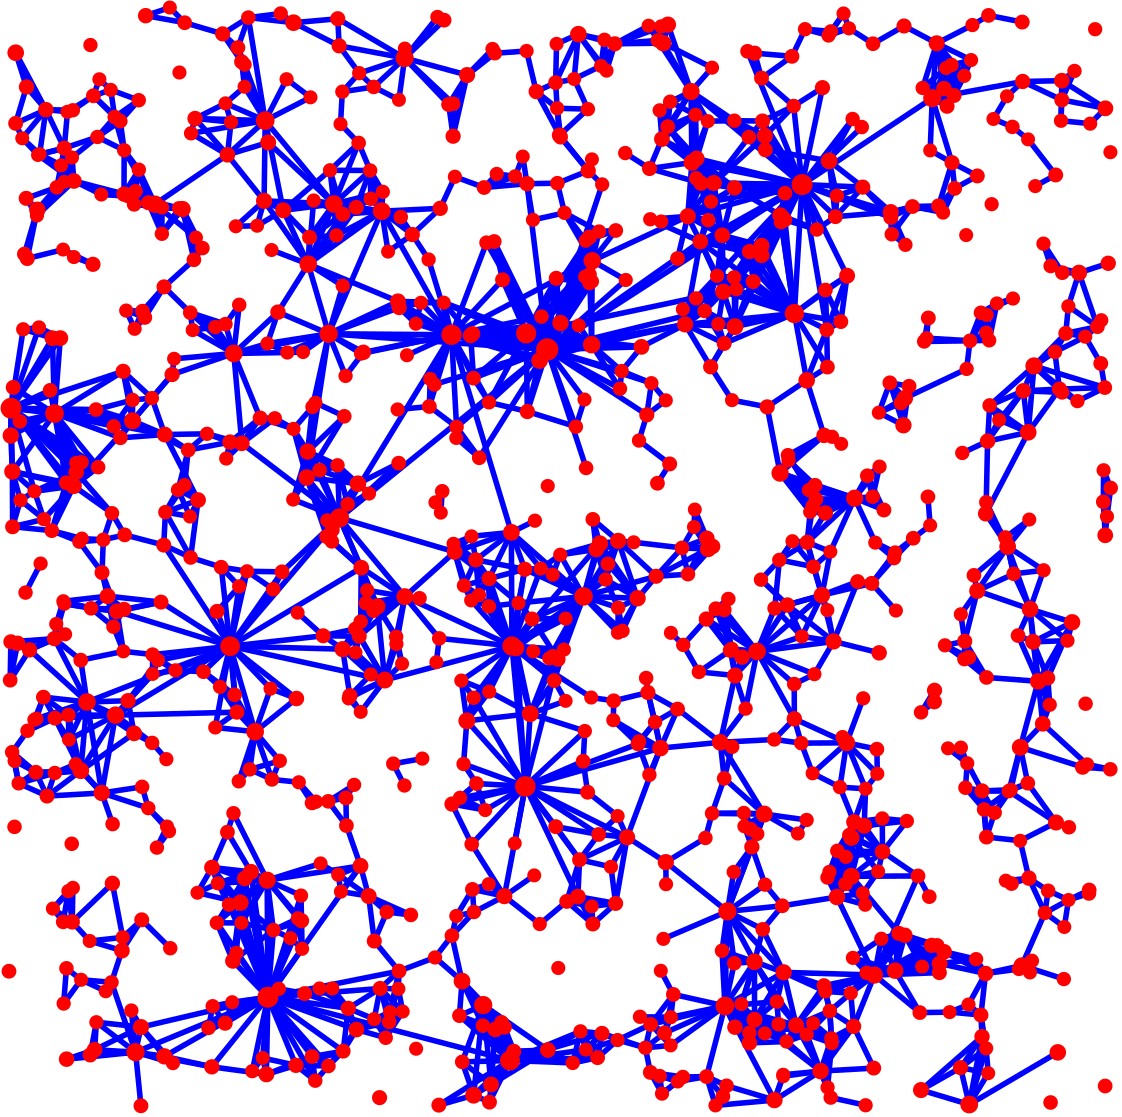
Although most of my work is very theoretical by nature, I very much like writing simulations/visualizations for the projects that I work on, to get a better intuition of the problems. Next to that, it is an important tool in transferring knowledge. In this post you can see two figures of the model that I worked on during my Master’s thesis, called scale-free percolation/geometric inhomogeneous random graphs. All vertices in this random graph model are endowed with a spatial location (in some dimension) and have an i.i.d. weight. By tuning the parameters correctly we can create (in)finite graphs where the degrees follow a power-law with any given parameter.
Feel free to use the below pictures for non-commercial use (but please credit me accordingly :)). Also, if you have any questions, or would like to have pictures with a custom parameter setting, you can always send me an e-mail.
Hubs in the graph (power-law exponent 2.9<3, long range parameter 6)
No hubs (power-law exponent 3.5>3, long range parameter 6)
The pictures are generated with Python, and in particular the graph package NetworkX. If I have some time in the near future, I might open source the code and add some more information and references on this page.